DFIR & data recovery
ArtifactExplorer
Evidence
- Data
- Public DFIR references, one registry (schema/sources.yaml) · 292 artifacts in 15 substrates; 34 convergences; 11 scenarios; 473 registered sources
- Key result
- Provenance coverage of its own artifacts: 50% → 95.5% at v5, then 292 of 292 at release, held by a build gate (structural: every record cites a registered source; no outside baseline)
- Stage
- Shipped
- Stack
- Markdown + YAML corpus, JSON Schema validation, Python build pipeline, d3 + 3d-force-graph static viewer, GitHub Pages
ArtifactExplorer in steps
A forensic artifact on its own is simply a variable. It does not on its own provide any forensic value.
DeviceSerial is simply an identifier, it is the relationships between the forensic substrates that provide forensic meaning.
Forensic Substrates contain these artifacts and forensically link them to other forensically relevant values.
DeviceSerial is a forensic identifier for a physical block storage device. VolumeGUID is the forensic identifier
When two artifacts are linked through a forensic substrate, we can form a Forensic Inference.
A DeviceSerial is forensically linked to the VolumeGUID directly through two forensic substrates; Winevtx 1006 - Partition diagnostic and the MountedDevices registry key.
The question
Can a body of reference knowledge that usually lives in scattered posts, vendor pages and cheat sheets be held as structured data, so that every entry says where its facts come from and how it connects to the others? ArtifactExplorer is my answer for Windows forensic artifacts: a corpus of plain-text records, a build that checks them, and an interactive graph to explore the result.
[JETT] One or two sentences on why this matters to an analyst and what question the graph helps answer.
The data model
Every record is a Markdown file with structured front matter, validated against a JSON schema. The model has two axes that I kept deliberately separate:
- Where the evidence lives: a substrate (a file-format family), a named instance of it, and the artifact itself, with its fields and their encodings.
- What can be concluded, in three tiers: single-artifact observations; convergences, where several artifacts are joined on a shared key value; and scenarios, stepwise walkthroughs that name the artifacts and join key for each step.
Shared keys are first-class concepts, so a join between two artifacts is an edge in the data, not a sentence in a write-up. Sources live in one registry, and every record cites registry IDs instead of carrying its own citations.
[JETT] What the three tiers mean in forensic terms, and why the strength rating on each scenario step matters.
From notes to a graph
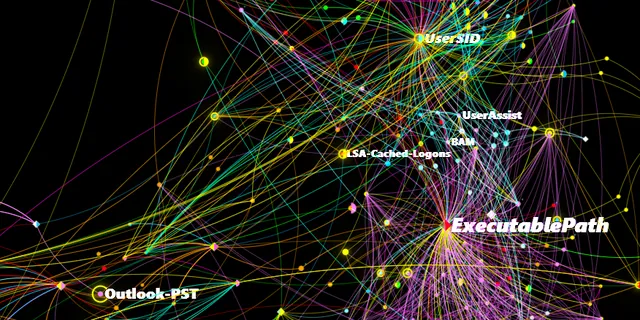
It began as a private study notebook and grew a viewer as the cross-references piled up. The viewer is a single static page that loads one compiled data file: a force-directed graph coloured by what each artifact links to, with a 2D substrate layout and a 3D view, an inspector for any node, a path finder that lists every documented route between two nodes, and a scenarios pane that reveals a walkthrough one step at a time.
Gave up free-text citations on each record → gained one source registry that every record points into, so a source is described once and the build can check every reference.
Gave up “rules” buried inside artifact records → gained convergences as their own files with their own schema, so a multi-artifact join can be read, validated and drawn on its own.
Gave up a hand-maintained list of what was sourced → gained a build gate: the compiled data file isn’t written if any record lacks a registered source.
How the build keeps it honest
Two Python scripts do the work. The validator checks every record against its schema and resolves every source ID; unknown IDs are errors, and loose matches between a source and the artifacts it claims to cover are reported as warnings for review. The build walks the corpus, compiles the graph and refuses to write the output when anything is unsourced. A separate sweep flags cited sources whose links have died, so that a record never depends only on a page that no longer exists.
The repo was made public in one cleaned-up pass after the private phase. Revisiting it later, I found the build only ran on my own machine (scripts pointed at my local folders, and one needed a file that was never committed), and the validator had started rejecting some newer registry entries. The repair makes the build run from a fresh clone and adds a check that runs it on every push; it goes live when the repo is relaunched.
How I used AI
I built this with Claude as a coding and drafting partner, and the repository carries a written disclosure of the split.
- What the assistant produced: most of the viewer’s JavaScript and CSS, drafts of the schema documentation, candidate citation formatting, and proposals for scripts.
- What I decided: the data model, the tiers and strength scale, every authoring policy, and what counted as an acceptable source.
- What checked it: the registry is the verified subset of sources; a citation the assistant suggested only counted once it was registered and checked against the original, and the build gate refuses anything else. Dead-link sweeps caught sources that had moved, and the validator caught entries that cited a source for something it doesn’t cover.
[JETT] One concrete example of a suggestion you rejected or rewrote, and what caught it.
Known limits
- It covers Windows only.
- Sourcing is enforced as structural: every record cites at least one registered source. That doesn’t prove each source supports each claim; the validator’s remaining warnings are the queue for that review.
- The graph is the only way in. There are no standalone pages per artifact, it isn’t built for phones, and keyboard use is limited.
- It’s frozen as a portfolio piece: the content reflects April 2026.
[JETT] Anything about the content’s limits that a practitioner would want to know.
Evaluation
What was measured, against what, and how.
Not measured yet. This project is shown with its stage only, not a weak number.
Outcome: No goal. An interactive knowledge graph of Windows forensic artifacts, built from public references; no outcome target set yet. Coverage: 292 artifacts across 15 substrates, linked by 34 convergences and walked through in 11 scenarios.
How I used AI
What the tools did, and what was checked.
Note to be written: tool and model, what the assistant produced, what was rejected or rewritten, and which check caught a problem.